TLDR; I coded a very easy to replicate data analytics report using R Markdown to track player progress for DistinXion. An interactive example of this report using LeBron James game statistics is published here.
What I wanted to improve for DistinXion
In my Summer 2020 Data Analytics Intern role at DistinXion, I was able to develop my problem-solving in a plethora of ways. Over that summer, my internship class piloted the first-ever data analytics program at DistinXion, a non-profit organization that administers basketball camps, tournaments, and private training, while emphasizing character and faith development. For DistinXion, we were tasked with building most of the data infrastructure, while also delivering insights on a week-to-week basis along to their tournament schedule.
DistinXion needed a way to attain detailed and actionable data insights in a quick manner, in order to give feedback to players and coaches on how to improve play going into the next game, tournament, or training session. Furthermore, DistinXion needed a way to bring more value to the organization while their athletes were playing with their high school teams.
My process for developing a solution
With permission from my supervisor, I tasked myself with making a software solution that takes in game statistics as input, and outputs a report that summarizes the player’s performance, presented in a manner that is detailed enough to deliver to a potential college coach, but also simple enough to deliver to a player’s family.
I worked in R Markdown to combine data analysis techniques I learned in school with new techniques I learned from surfing the web. My main priority was to create a report that was simple to replicate by DistinXion staff long after my internship ended.
I designed data input to be through Google Forms and Google Sheets, as these were two platforms that were commonly used throughout the organization. Then, the beauty of it all was the user would only have to open R Studio, type in a few player ID’s for whose reports they want to generate, then click Run. The code would call the R Markdown file and run it for each of those Player ID’s, then save each report as a separate file to the user’s computer.
The Solution
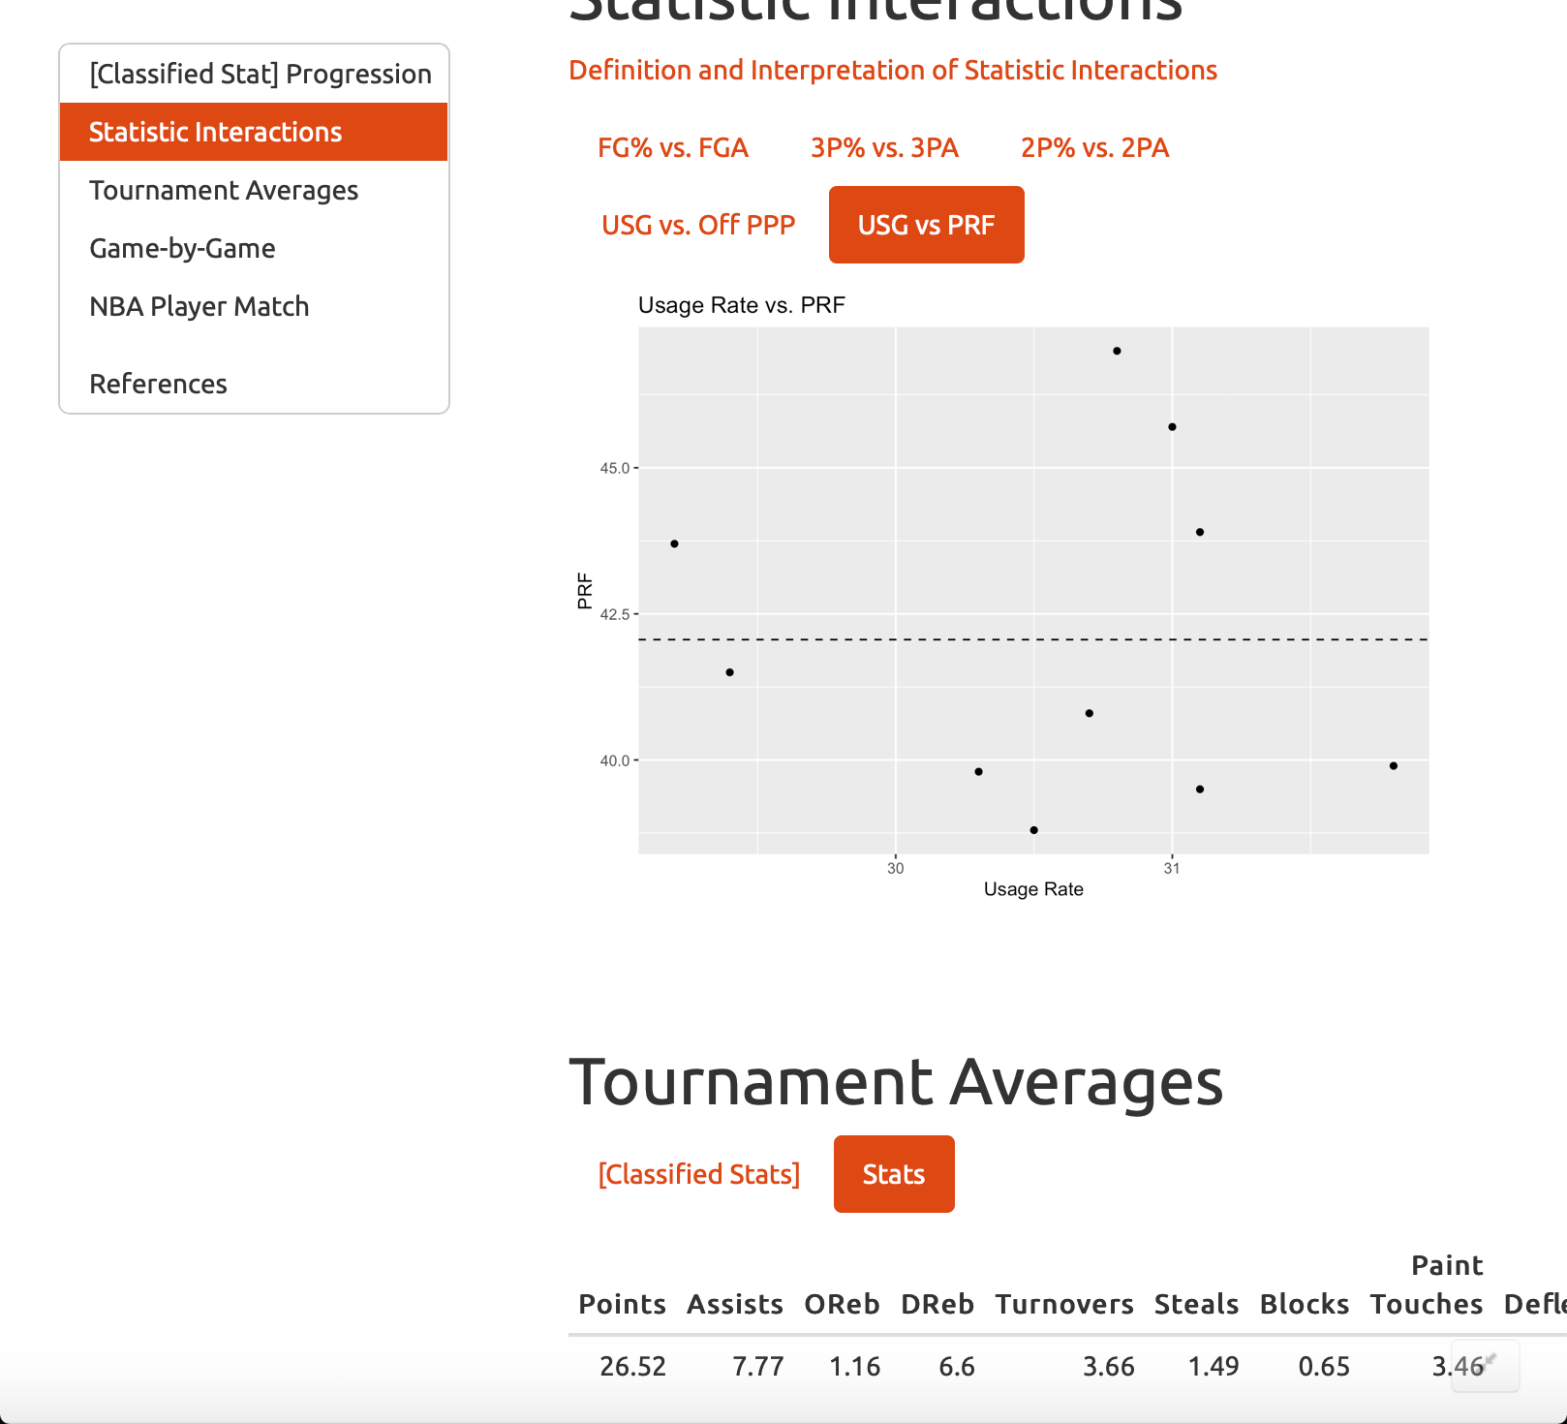
The contents of the report are: [Classified Stat] Progression, Average Statistics, and Game-by-Game Statistics, and these are explained in detail on this Google Doc
By coding this report, DistinXion is now able to access insights from game data quickly and effectively. While I was still with them, they were using the report to summarize and analyze players’ tournament performances for coaches to review and for families who could not go to the games due to COVID-19 social distancing regulations to get a recap of the tournament. Going forward, DistinXion can provide these reports to their athletes while they are with their high school teams so that these players can also track how they are progressing during their high school seasons.
I published an interactive working report on RPubs. For this example I used 10 years of LeBron James game data, from 2010-2019. Each year’s average statistics represents 1 game in a tournament.
